Zero Signal – A Structural Fragility Framework for Modern Markets
Zero Signal
A Structural Fragility Framework for Modern Markets
Pavel Miska
Senior Software Engineer / Quant Systems Architecture
Nuremberg, 2026
Executive Summary
This paper presents a structural risk framework designed to detect systemic fragility in financial markets – not through prediction, but through state observation.
At its core lies the concept of Zero Signal:
A market state in which conventional indicators (volatility, price, correlations) appear calm – while structural stress accumulates beneath the surface.
Tail risk is not a statistical outlier. It is the result of market mechanics:
- Liquidity becomes one-sided
- Leverage builds up
- Cross-asset couplings tighten
- Crowd behavior (Mass Hypnosis) synchronizes participants
The framework uses explainable machine learning to surface these mechanisms – not as an oracle, but as decision support for humans.
The Decision Layer translates complex patterns into a readable state report – without alarms, without pressure, but with a clear indication of Zero Signal.
The framework is:
- regulatory-compliant (explainable, documented, auditable)
- modular and extensible
- practical (daily data, no real-time required)
- independent of expensive data vendors
The goal is not to predict the next crash, but to make stillness readable – as a tool for portfolio managers, risk controllers, and anyone willing to look closely.
Abstract
Zero Signal is a structural risk framework designed to detect systemic fragility in modern financial markets. It integrates behavioral, structural, and narrative-driven signals with explainable machine-learning methods to identify stress accumulation, regime shifts, and cross-asset propagation effects. The framework is optimized for portfolio management environments, using daily and delayed intraday data – rather than real-time feeds – to ensure regulatory compatibility and operational robustness.
1. Introduction
In recent decades, finance has increasingly relied on models. Data has become more granular, algorithms faster, computing power cheaper.
And yet: The largest losses do not occur during periods of high volatility. They occur during periods when all indicators appear calm.
We call this: Zero Signal.
Zero Signal is not the absence of information. It is the presence of a silence that standard models cannot read. A silence in which tail risk matures – unnoticed, unmeasured, misunderstood.
Zero Signal is not a theoretical construct.
It is a state that can have severe consequences in practice – not because models fail, but because they cannot read the silence.
This paper is an attempt to make that silence readable – not as a panacea, but as a tool for those willing to look.
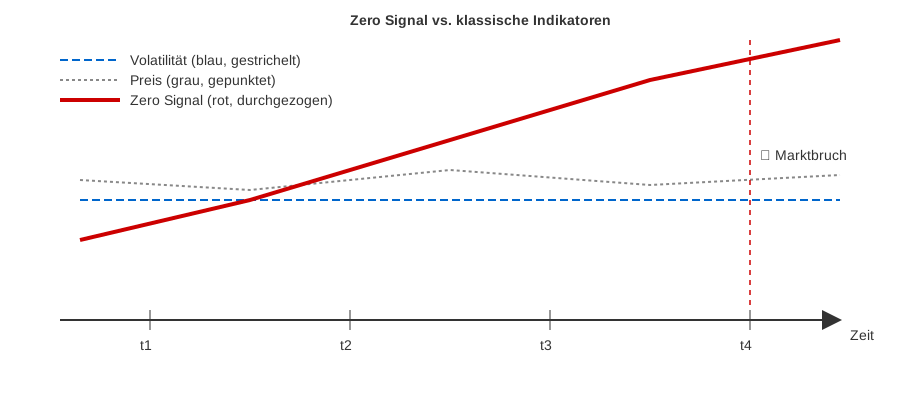
Figure 1: Zero Signal rises – while volatility and price remain calm.
2. Methodological Stance
We are not forecasters. We are system observers.
Our goal is not to predict the next event, but to perceive changes in state.
- We do not search for the next crash.
- We search for changes in market mechanics.
- We do not rely on historical probabilities.
- We rely on structural patterns.
Machine learning is not an oracle for us – it is a tool to make these patterns visible.
3. Market Psychology
Markets are not physical systems. They have no natural laws, no constants, no guaranteed symmetries.
And yet they behave as if they had structures: recurring patterns, fracture points, stress points.
These structures arise from behavior, liquidity, expectations, positioning – and from the models we ourselves use.
The psychology of market participants is not a marginal phenomenon. It is a driver of many of the patterns we observe – especially in phases of silence.
4. Behavioral Fragility
Behavioral Fragility describes the noise in the system – the erratic, sometimes irrational reactions of market participants.
It is not systemic. It is an amplifier.
Behavioral Fragility reveals existing structural weaknesses by activating them. It is not the cause of tail risk – but it can accelerate it when the mechanics are already fragile.
5. News & Narrative Dynamics
News are not systemic drivers. They are indicators of the volume of noise.
We do not analyze the truth content of news. We measure:
- Volume: How many articles appear on a topic?
- Divergence: Are different perspectives shown – or do they all say the same?
- Emotional charge: Not just positive/negative, but urgency.
A narrative alone is harmless. But when a narrative coincides with thin market depth, it becomes dangerous – because everyone reacts at the same time.
6. Mass Hypnosis – Why Crowd Behavior Is the True Core of Tail Risk
Tail risk does not originate from prices.
It originates from people.
Not from fundamentals. Not from models. Not from news.
But from collective trance.
Call it by its name: Mass Hypnosis.
This is the state in which many market participants:
- follow the same strategy
- trade the same direction
- use the same hedges
- rely on the same models
They no longer act on analysis – they act because everyone else does.
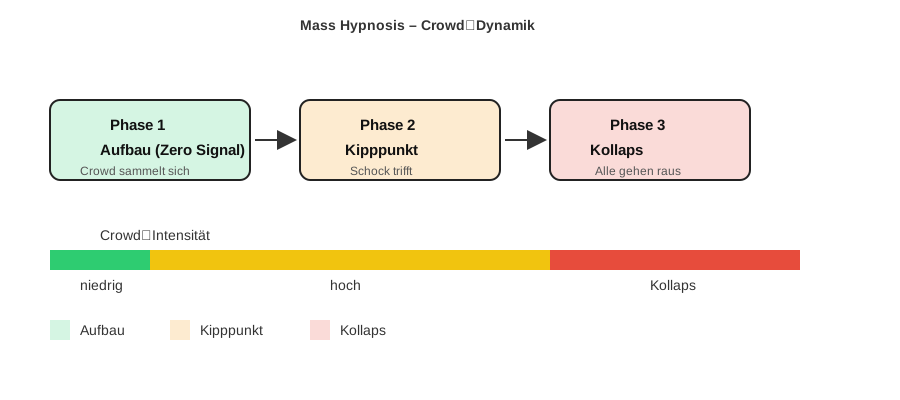
Figure 2: The three phases of crowd dynamics: build-up (Zero Signal) → tipping point → collapse.
6.1 How Mass Hypnosis Emerges
Mass Hypnosis is not accidental. It arises from:
- Success reinforcement: A strategy works – more and more participants join.
- Risk parity effects: Volatility declines – everyone increases exposure.
- Model convergence: Everyone uses the same risk models – everyone reaches the same conclusions.
- Performance pressure: No one wants to fall behind – so everyone joins in.
The result: an invisible alignment of the market.
6.2 Why Mass Hypnosis Is Dangerous
As long as nothing happens, this appears stable.
But this stability is deceptive – it is Zero Signal.
Beneath the surface:
- Liquidity becomes one-sided
- Order flow becomes correlated
- Hedging becomes synchronized
- Funding becomes simultaneously strained
- Exit doors narrow
When a shock comes – even a small one –
everyone wakes up at the same time.
This is what we call tail risk:
- Price falls → positioning becomes riskier
- Forced selling → price falls further
- Hedging amplifies the move
- Liquidity vanishes
This is not panic.
This is the logical consequence of Mass Hypnosis.
6.3 The Mechanism of Mass Hypnosis – An Abstract Model
Mass Hypnosis is not a vague feeling.
It is a state that can be described by a recurring pattern – independent of the specific instrument.
The pattern consists of three phases:
Phase 1 – Reinforcement
A market segment or strategy shows success.
This attracts new participants – not because of fundamentals, but because of success itself.
Prices rise, drawing in more participants.
A self-reinforcing cycle begins.
Phase 2 – Alignment
More and more participants act according to the same pattern.
Diversity of opinion decreases – counter-signals are ignored.
Liquidity becomes one-sided: there are many buyers, but few sellers.
Phase 3 – Tipping Point
An external shock – large or small – hits the system.
One-sided liquidity breaks down.
Participants try to unwind their positions simultaneously.
Since there is no counterparty left, the price falls sharply – much more than fundamentals would justify.
6.4 Why This Model Matters
This abstract pattern describes the core of tail risk:
- Stillness (Zero Signal): The reinforcement phase runs – without classical indicators raising an alarm.
- Break (Tail Risk): The alignment tips – and the market overreacts.
The model is independent of any specific instrument.
It describes a principle that can be observed across many markets and strategies.
6.5 A Final Thought on Mass Hypnosis
Mass Hypnosis is not a metaphor.
It is the state in which markets forget themselves – until they suddenly remember.
Those who rely only on conventional indicators in this state are not acting cautiously – they are acting blindly.
The Zero Signal framework offers no certainty.
But it offers a chance to read the silence – before it breaks.
7. Tail Risk
Tail risk is not a “rare event”.
Tail risk is a state of the market in which the usual assumptions no longer hold.
It is the domain where:
- liquidity disappears
- correlations collapse
- price reactions become non-linear
- hedging becomes inefficient
- models lose their validity
- positioning and funding matter more than fundamentals
Tail risk is therefore not a statistical phenomenon,
but a structural one.
8. The Five Structural Stress Channels
Stress does not arise from price movements.
Stress arises from mechanics.
We have identified five structural drivers that generate tail risk:
- Liquidity – the most important factor. When it thins out, a small order can cause a large move.
- Leverage & Funding – the amplifier. Margin calls force selling, selling pushes prices down – a cycle.
- Cross-Asset Coupling – the transmission path. A shock in credit hits equity, then FX, then volatility.
- Options Gamma & Vol Feedback – the accelerator. Dealers hedge – and their hedging amplifies the move.
- Positioning & Crowd Behavior – the trap. When everyone holds the same position, the exit becomes a bottleneck.
These five drivers are not independent.
They reinforce each other.
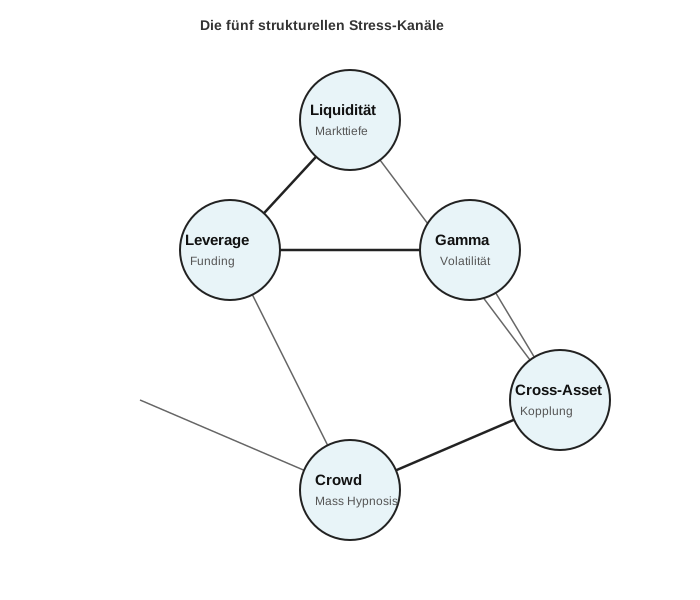
Figure 3: Network of the five drivers and their interactions.
9. Stress Cascade
Stress does not spread linearly.
Typical cascade:
Rates → FX → Equity → Credit → Funding → Liquidity
This is stress propagation.
A cascade does not emerge suddenly.
It builds over time – in the stillness of Zero Signal.

Figure 4: Domino chain of stress propagation – with feedback loop.
10. Classical Models and Their Limitations
Classical risk models rely on historical data. They recognize patterns that have occurred before.
Tail risk, by definition, is an event that does not appear in history – or so rarely that it is statistically inaccessible.
In the tail:
- returns are not normal
- delta is wrong
- gamma dominates
- correlations jump
- liquidity disappears
- models break
This is why classical models underestimate:
- crash speed
- crash depth
- cross-asset effects
- hedging costs
- liquidity risk
Tail risk is therefore a model failure,
not a data problem.
11. Machine Learning Architecture
11.0 Why ML – and Not Just Rules or Statistics?
ML is not used in this framework because it is “modern”.
It is used because the problem is structurally different from what classical methods can address.
Classical models:
- require fixed assumptions (normality, linearity)
- only recognize what they already know
- react to events – not to states
ML can:
- detect states that are not predefined
- evaluate combinations of signals that appear harmless individually
- find patterns in the noise – where classical indicators fall silent
The goal is not to build a better forecasting model.
The goal is to create a system that can read silence –
before it becomes a threat.
ML is not a cure-all – but it is a suitable tool, because it can capture the complexity that arises in Zero Signal phases.
11.1 Architectural Overview
The ML architecture of the Zero Signal framework follows a modular, extensible design.
The core consists of explainable ensemble models (e.g., Gradient Boosting or Random Forest) that process structural and behavioral features.
The architecture includes interfaces for additional modules – in particular for:
- deep learning-based processing of news and narratives
- unsupervised learning for detecting unknown regimes
- real-time capable anomaly detection
The outputs of all modules are merged in a Stress Engine – not as a weighted sum, but as a state description.
12. Feature Engineering
The feature engineering follows a three-part strategy:
12.1 Structural Features
- market depth across multiple order book levels
- liquidity concentration
- correlation dynamics (rate of change)
- resilience (recovery speed)
12.2 Behavioral Features
- sentiment drift from news
- trading time anomalies
- herding index
- narrative density
12.3 Dynamic Features
- correlation speed
- liquidity decay rate
- volatility change (pace)
The three feature classes are combined into a state vector – not treated in isolation.
13. Regime Detection
A regime is a market state characterized by a stable pattern in the features.
Regimes are not predefined – they are discovered from the data.
Zero Signal is not an error – it is a regime of its own.
A regime in which classical indicators are calm, but structural features already signal change.
The art is to detect this regime early – not as an alarm, but as a pointer.
14. Anomaly Detection
Anomaly detection is not reactive – it is early-warning.
An anomaly is not evaluated as a single event, but in the context of the current regime.
If the regime is stable, an anomaly is weighted differently than in an already fragile regime.
This makes anomaly detection context-sensitive – and that is the key difference from standard models.
15. Stress Engine
The Stress Engine does not evaluate the strength of individual signals – but their coupling.
A high value in anomaly detection becomes critical only when regime detection also shows deviation and structural features indicate decreasing liquidity.
This is system observation in its purest form:
not the individual component matters, but the relationship between components.
16. Decision Layer
The Decision Layer is not a black box.
It is a bridge.
It takes the outputs of all previous steps and translates them into a form that humans can understand and use.
What the Decision Layer does not do:
- No alarms
- No recommendations
- No automated positioning
- No risk scores in numbers
What the Decision Layer does:
- Generates a state report in natural language
- Shows the five drivers in context
- Marks Zero Signal – without alarm
- Documents observations for later review
The Decision Layer is designed for portfolio management – not for HFT or market making.
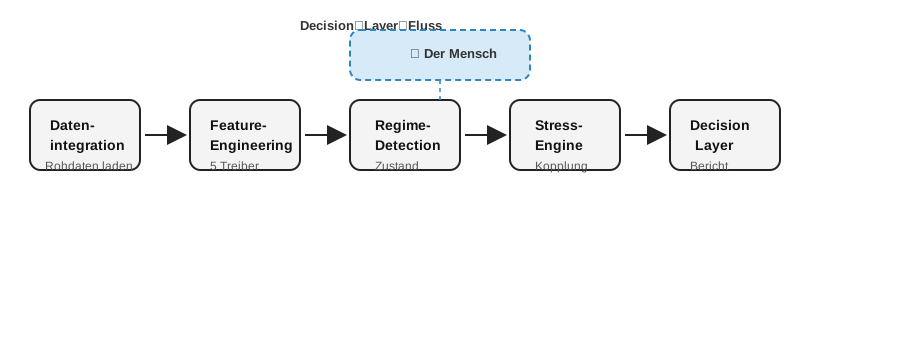
Figure 5: Process chain from data input to human decision-maker.
17. Data Types
17.0 What We Mean by Market Data
Many risk models use as input: prices, returns, volatility, correlations.
This is the surface.
Our framework uses as input the data that contains tail risk:
- liquidity
- order flow
- funding
- positioning
- cross-asset couplings
- vol structure
- credit spreads
- repo rates
- basis spreads
- dealer gamma
- ETF flows
- options open interest
This is the engine room of the market.
Prices are merely the echo – not the cause.
17.1 The Three Categories of Tail Risk Data
| Category | Function | Examples |
|---|---|---|
| A – Announcement | Shows that stress is emerging | Credit spreads, funding rates, vol term structure, repo rates, liquidity metrics |
| B – Amplification | Shows how severe a shock will be | Dealer gamma, vega exposure, CTA trend signals, risk parity leverage, ETF flows, options open interest |
| C – Propagation | Shows where stress moves to | Cross-asset correlations, vol-of-vol, credit-equity coupling, rates-FX spillover, macro regime shifts |
17.2 The Mechanism Behind the Data
The three categories describe a cycle:
- Liquidity becomes one-sided (Category A)
- Leverage builds up (Category B)
- Couplings tighten (Category C)
When all three steps are active simultaneously – but classical indicators show calm – then Zero Signal emerges.
18. Latency Matrix
Latency is not our enemy.
Latency is a factor we account for.
The latency matrix describes for each data source:
- typical latency
- maximum latency
- volatility of latency
- impact on decision-making
Example:
- End-of-Day prices: 1–2 hours latency → low impact
- COT data: 3 days latency → used as a trend indicator
- Sentiment data: real-time → aggregated over hours
Latency is considered in the Decision Layer – as a note on data reliability.
19. System Architecture – From Data Aggregator to Risk Report
The Zero Signal framework is not an isolated model.
It is a system that ingests, processes, evaluates, and prepares data for humans.
The following architecture describes the conceptual structure – independent of specific technologies or data vendors.
19.1 Data Aggregation (conceptual)
Data comes from various sources – public, standardized, or internal feeds.
They are collected in an aggregator, normalized, and prepared for processing.
19.2 Feature Engine (internal)
From the raw data, the five structural drivers are computed:
- Liquidity
- Leverage / Funding
- Cross-Asset
- Gamma / Volatility
- Crowd / Mass Hypnosis
The features are merged into a state vector – not treated as individual indicators.
19.3 ML Modules (core)
Three modules work in parallel:
- Regime Detection – identifies the current market state (including Zero Signal)
- Anomaly Detection – finds deviations from normal behavior
- Stress Engine – evaluates driver coupling and cascade potential
19.4 Decision Layer (human interface)
The Decision Layer generates a state report in natural language:
- current regime
- driver deviations
- Zero Signal indication
- documented basis for decisions
19.5 Integration into Existing Processes
The framework is modular.
It can in principle be connected to various data sources and existing risk processes – but the concrete implementation is not part of this paper and is left to practical application.
20. Limitations & Risks
No framework is perfect. This one is no exception.
- Data latency – some indicators are only available with delay.
- False positives – the system will flag periods where nothing happens.
- No prediction – only state description.
- Data quality – errors in sources lead to errors in output.
- Applicability – not suitable for HFT or market making.
- Human uncertainty – users may ignore or misinterpret the report.
- No liability – this paper is a concept, not a product.
The system does not replace decisions – it supports them.
21. Conclusion
Zero Signal is not a marginal phenomenon.
It is the state in which markets often reside – and where most models are blind.
Tail risk is not a statistical accident –
it is the result of mechanics: liquidity, leverage, couplings, crowd behavior.
ML can help make these mechanics visible –
but it cannot replace the human.
The decision lies not in the algorithm –
but in the mind of the one who reads the report.
We have not delivered a new formula –
but a framework in which risk becomes visible before it arrives.
Zero Signal is not a weakness of models.
Zero Signal is a property of reality.
The art is not to prevent the storm –
but to understand the silence.
And sometimes that means:
looking before everyone else wakes up.
Appendix
Diagrams, figures, and supplementary material will follow in separate appendices.
Contact
Pavel Miska
Senior Software Engineer / Quant Systems Architecture
Nuremberg, Germany
2026
Echoes from the Machine – The Geometry of Stress (revised edition)